Study Design
|
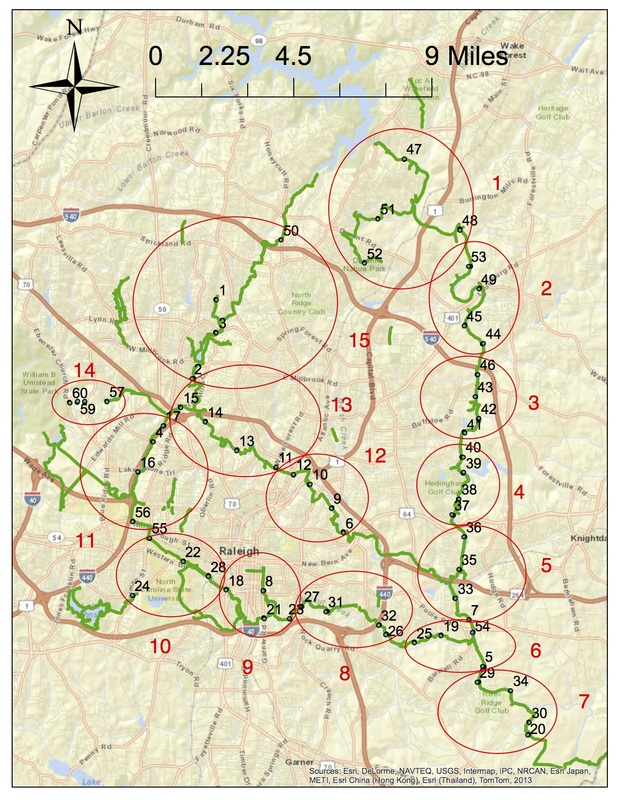
The overall study was designed with 15 clusters (red circles numbered 1-15 in the map below) with 4 sites in each, for a total of 60 sites (numbered 1-60 in the map below).
At each site, we planned to deploy a pair of cameras - one on the trail and one approximately 25m off the trail - to capture data for our study of people and wildlife. In 2014, cameras were on site at half the sites for 3 weeks in February and on the other half for 3 weeks in March. In 2016, we place camera on 27 sites - approximately two per cluster - and only on the trail. We also used the sites as points of reference for collecting data about land use, plants, soil, and water. |
We did not get data from every site. We were unable to deploy cameras at some locations and some cameras malfunctioned or were stolen. In the end, we analyzed data camera data from 42 sites in 2014 and 23 sites in 2016. Unfortunately, we cannot compare the data from the two years because of errors in camera deployment and settings in 2016.
We also did some sub-sampling, because we didn't have resources to collect fully detailed data at every site. For example, in 2014 we have detailed data about gender, approximate age, and type of greenway use by people for 26 of the 42 sites; at the other 16 we have simple counts only. |
Cameras to Count People and Wildlife (2014, 2016)
|
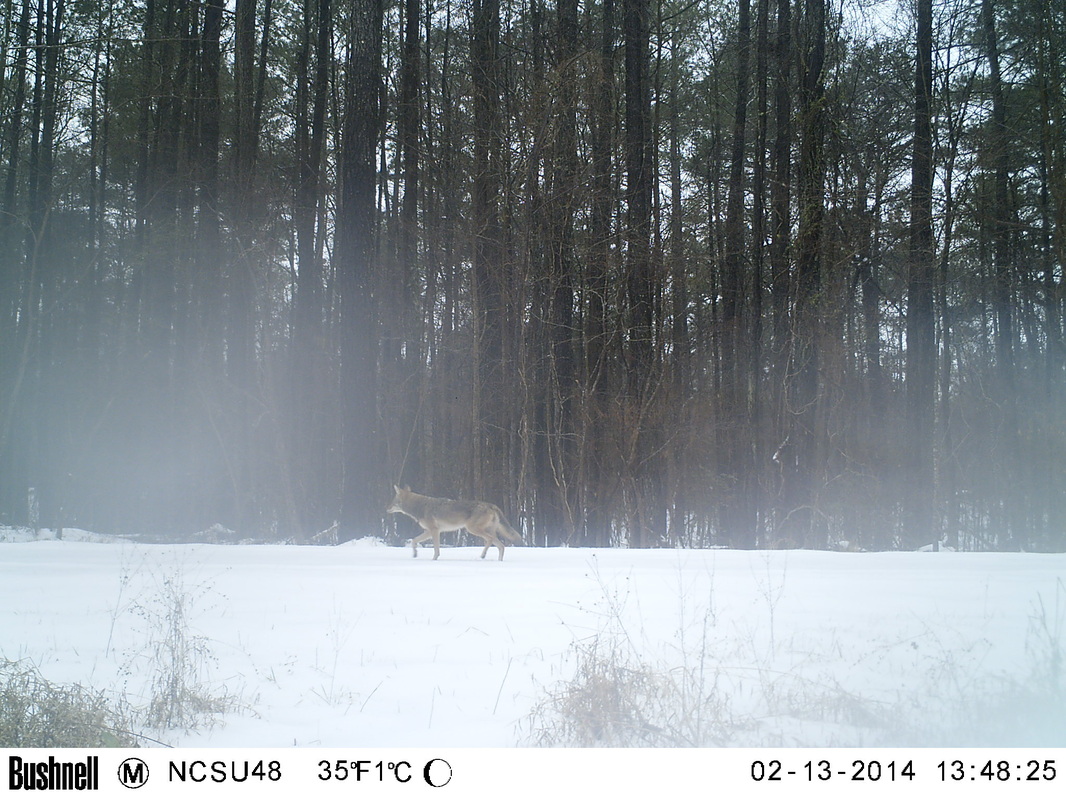
We used Bushnell Trophy Cam HD cameras to count people and wildlife.
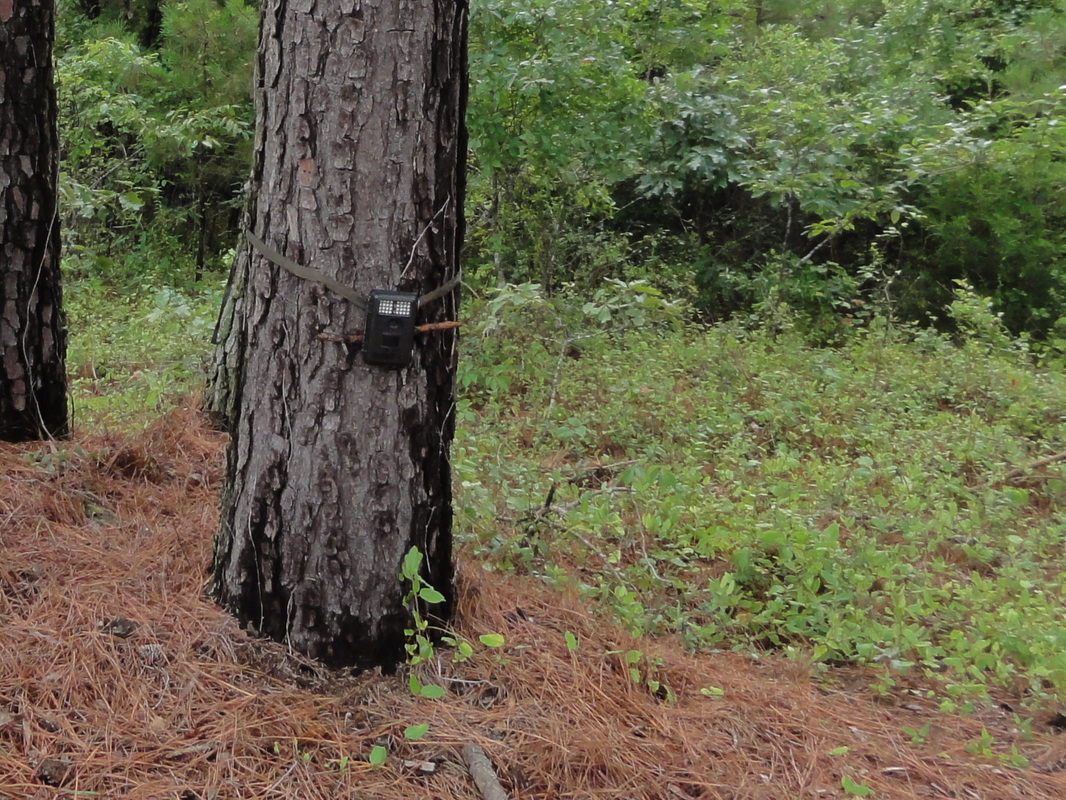
A Bushnell Trophy Cam HD camera attached to a tree.
|
The cameras sense heat and motion and can operate 24 hours a day, using an infrared flash for night images – there's no blinding flash to disturb wildlife.
|
|
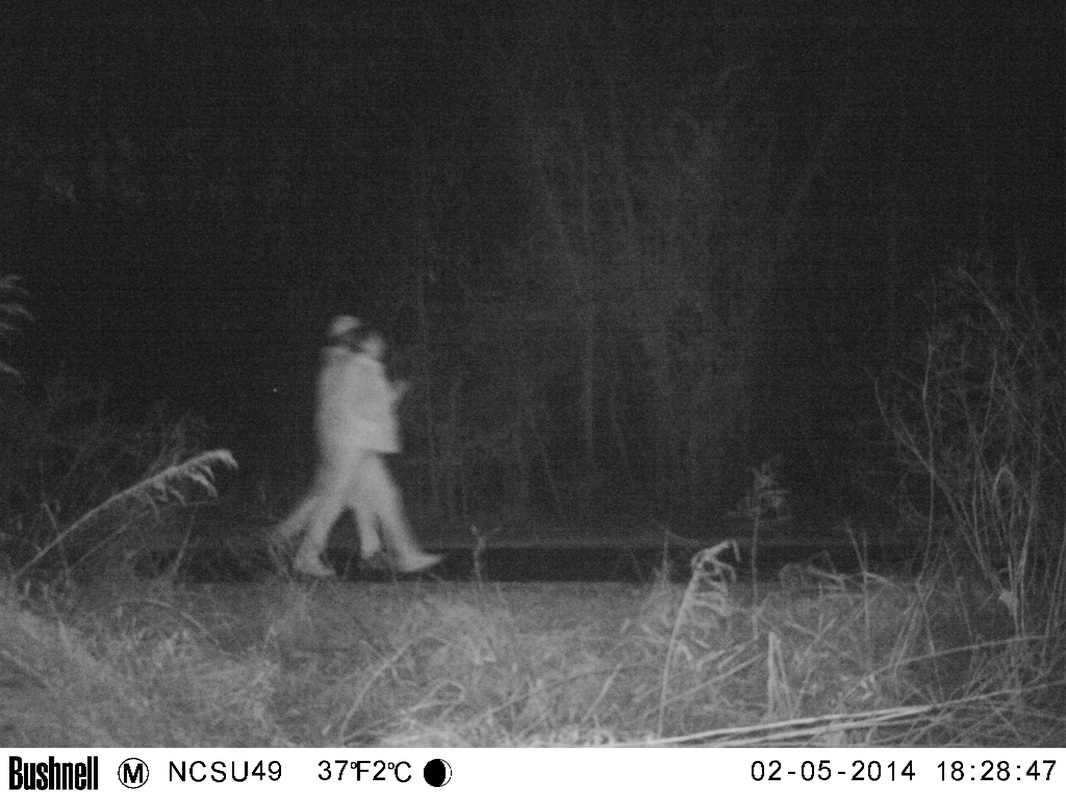
Once triggered, the camera records images until the motion stops. We interpreted images using a program called eMammal, which is operated by the Smithsonian Institution. We took extra steps to tally the activities of people using the greenways – such as walking, running, riding – as well as some of their characteristics – such as gender and age. |
|
Privacy Concerns. While there is no legal expectation of or requirement for privacy in public places, we were sensitive to privacy issues. Images of people were governed by a privacy protocol approved by NC State University's Institutional Review Board for the Protection of Human Subjects in Research (Study #3711). Images were not to be shared outside the research team, uploaded to the internet, or in any other way made public; they will be destroyed when the study is complete. Any images used in presentations have identifying features blurred or otherwise obscured.
|
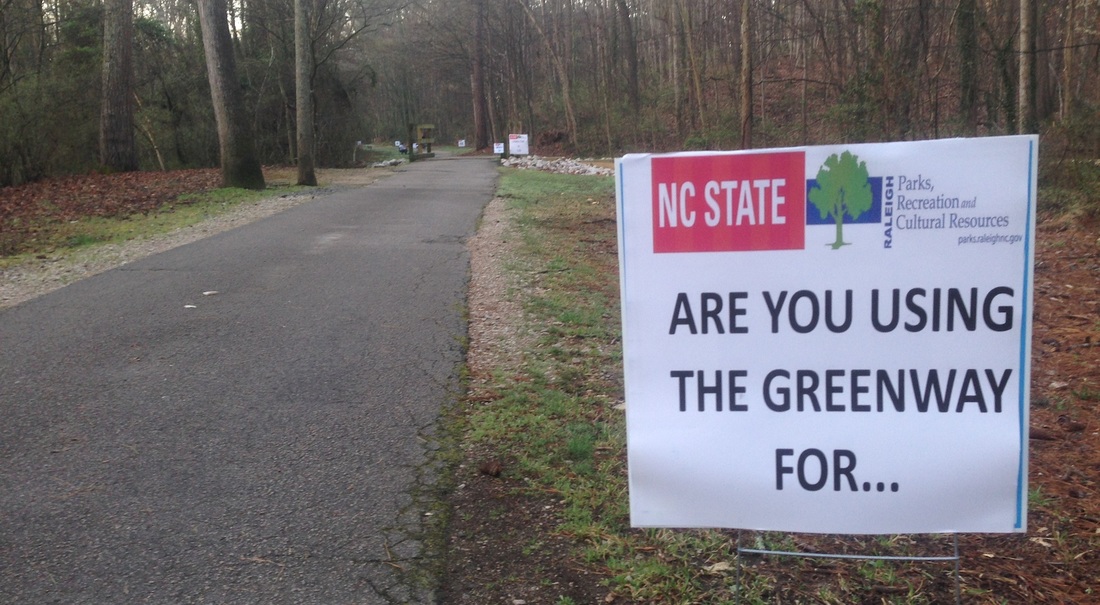
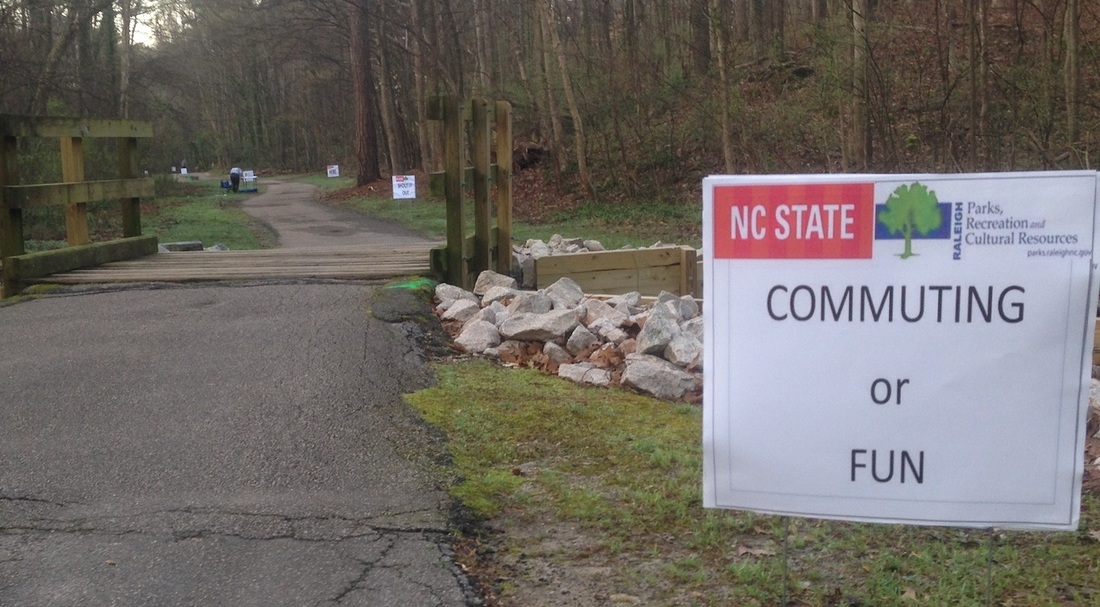
Commuting or Fun? (2016)
We developed what we think is a new type of survey to collect information about whether people were using the trail for transportation or recreation. We called it a Shout-out Survey, because we asked people to shout out "commute" or "fun" on their way past a survey station - no need to stop. We collected data about 541 people at the same 4 sites used for the intercept surveys.
Why are you here?
|
Soil Compaction (2014)
|
Water Infiltration into Soil (2014)
|
|
We measured soil compaction using bulk density - weight-per-unit-volume - at 55 sites along the greenway system. At each site, a pair of soil samples was collected. One of each pair was from within 3-6 feet of the trail edge, the other was from well off the trail in undisturbed vegetation.
|
Infiltration of water into soil is measured quite simply - a known volume of water in a tube is placed on the soil and we measure how long it takes for the water to leave the tube.
|
Plant Species Composition (2014)
In 2014, our plant measures were developed along a set of transects at each of 54 study sites. At each of 3 locations 15-meters apart along the trail we established a 15-meter transect on each side of the trail, for a total of 6 transects.
We recorded all plant species observed while walking each transect and identified the ground cover at 1-meter increments along each transect. We collected basal area using a 10-factor prism at the end of each transect. 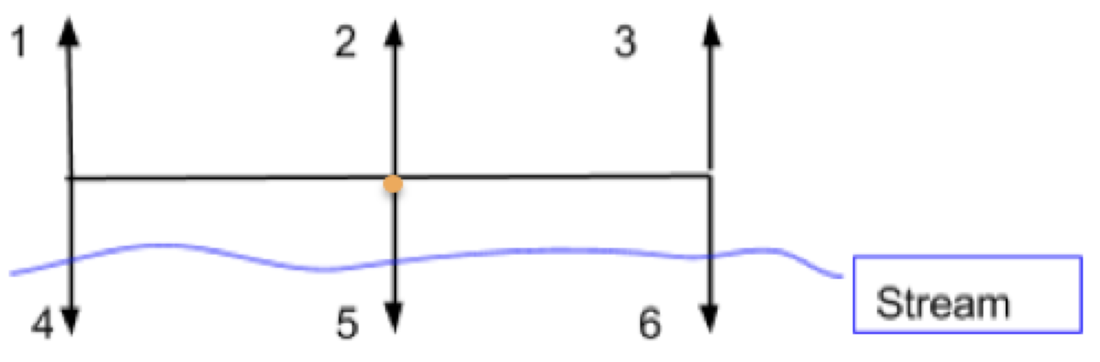
|
Water (2014, 2016)
We tested water quality at 26 sites in the rivers and creeks adjacent to Raleigh's greenway system on two dates - 26 February and 9 April, 2014.
We used a device called a sonde to measure several physical parameters: dissolved oxygen, pH (acidity and basicity), temperature, and turbidity (cloudiness). We used test strips to measure the levels of nitrates and phosphates, nutrients that can cause excessive growth of algae. In 2016, we tested water quality at three sites near the Milburnie Dam, which is slated for removal in 2017. |
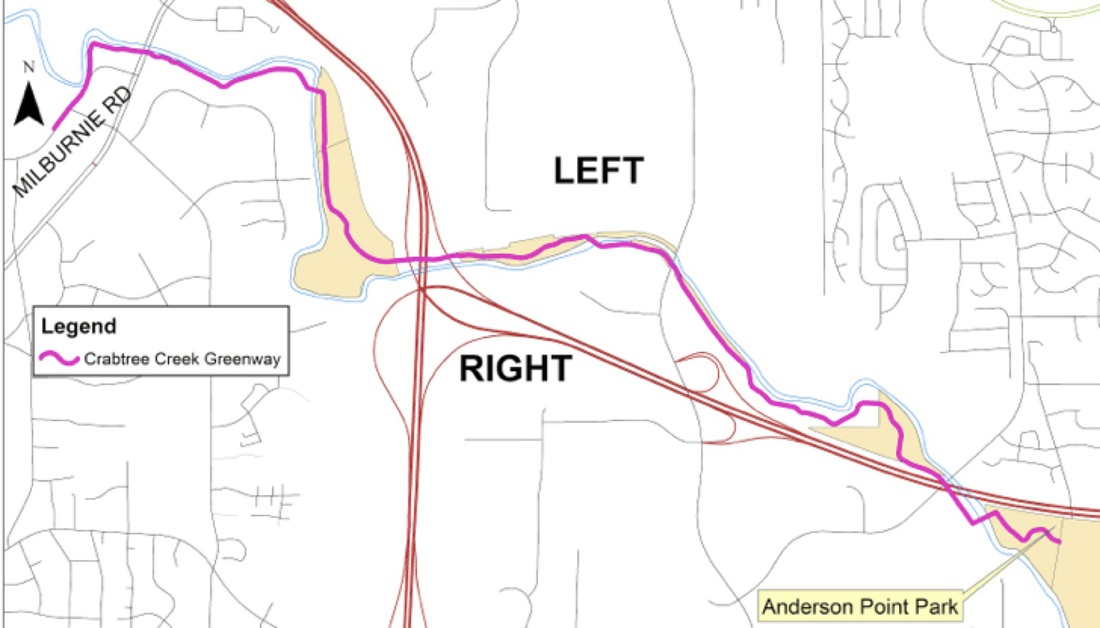
Invasive Plants (2016)
In 2016, we mapped the occurrence and density of five invasive plants along the recently-opened, 4-mile Crabtree Creek Connector between Anderson Point Park to the east and Milburnie Road to the west.
|
|
Additional Work. We expect that level and type of activity vary with season. Our data were collected during February and March, probably one of the slowest times of year for outdoor activities and greenways. Collecting data seasonally or continuously would provide more holistic information about greenway use. Additional shout-out surveys to determine use for errands, recreation, and transportation are planned for summer and fall, 2016.
This effort is a collaboration among NC State University; Raleigh Parks, Recreation, & Cultural Resources; the Nature Research Center of the NC Museum of Natural Sciences; and WakeNature Preserves Partnership. This effort is being led and conducted by students in a course on Natural Resources Measurements at NC State University.
